Geographic Information Systems and IT solutions for the environment
Geographic Information Systems and IT solutions for the environment
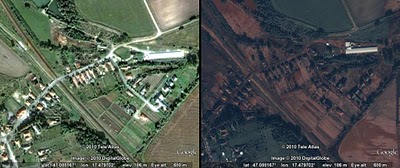
Athabasca oil sands mining
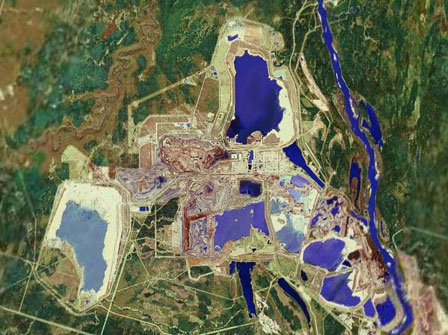
The image on the right depicts a mine in the Athabascan region. Once covered by ancient boreal forest the depicted area is now occupied by huge ponds of toxic fluids.
The region holds locked into the sand under its boreal forest on indigenous land, the second largest deposit of oil after Saudia Arabia, but in a very different form. The oil is present as bitumen and to be extracted requires the clearing of the forest, the removal of hundreds of feet of soil and the use of enormous amounts of water to make it fluid with consequent land, water and air pollution. As the energy required to extract the oil is only slightly lower than the energy that will be derived from it, this type of mining has only become "economically" feasible in the latest years.
Read more from a National Geographic article and the Greenpeace Canada campaign. The Tar Sand Action guided by Bill McKibben is protesting against the construction of a huge pipeline that should transport the tar sand oil from Canada to US States. You can also watch documentaries such as Petropolis and H2Oil.
Free E-book: GIS for the Oceans
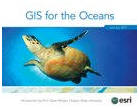
A collection of GIS case studies in marine science introduced by Dawn Wright professor of geography and oceanography at Oregon State University and a fellow of the American Association for the Advancement of Science. The book showcases how GIS can assist meeting the grand challenges facing marine science.
Cartography: Making Color Blind Friendly Maps
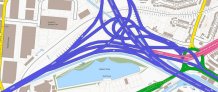
Britain's National mapping agency is working to develop colour schemas for map symbology that works well for everybody including people affected by Colour Vision Deficiency (CVD).
CVD basically means an inability to see certain colours; often red and green, but also other colours too. It affects approximately one in 12 men and one in 100 women in the UK and can make the colours that have traditionally used for maps virtually indistinguishable. That’s a sizable minority of the population, all with a problem that is often forgotten or overlooked.
The agency hired a number of people affected by CVD and let them assess various combinations of colours.
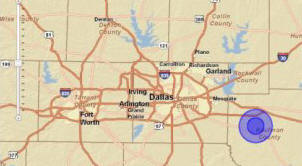
Technical tip: Drop Shapefiles, Text Files, and GPX Files Directly onto Your Web Maps with ArcGIS Online
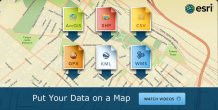
With the latest release of ArcGIS Online, you can now add shapefiles, text files (TXT and CSV), and GPX files directly to your web map. You can drag data from your computer onto your map or, with just the click of a button, add it to your map in the ArcGIS.com map viewer or ArcGIS Explorer Online. Once you’ve added your data, you can configure pop-up windows and change the symbols.
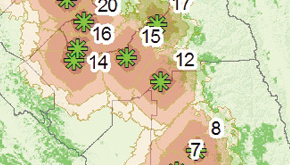
Google Earth KML: The Appalachian Mountain top Removal layer
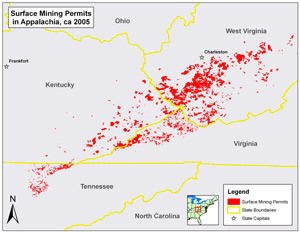
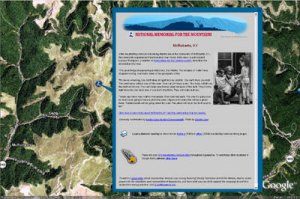
The Mountaintop Removal layer available under the Global Awareness directory of Google Earth has exposed the areas affected by this destructive mining practise to the world rising awareness of the issue among citizens worldwide.
The layer includes fly through over the mining sites, descriptive balloons of each sites and before and after overlays. Additionally through the "My Connection" tool, visitors are linked to an interactive PHP web page where their zip code, typed into a web form, is used to query a MySQL database to identify their particular electricity provider, the coal-fired power plants operated by that utility, and the actual mine sites that have supplied those plants with coal over the past five years.
Mountaintop removal coal mining is changing the American landscape on a scale that is hard to comprehend unless you see it from the air. Anyone who has ever flown in a small aircraft over southern West Virginia or eastern Kentucky will never forget the experience of seeing the massive scale of destruction - mountain after mountain blown up and dumped into valleys as far as the eye can see. Mountaintop removal affects more than mountains and streams, however; it is threatening to displace and destroy a distinctly American culture that has persisted in the Appalachian Mountains for generations.
Mountaintop removal is a relatively new type of coal mining that began in Appalachia in the 1970s as an extension of conventional strip mining techniques. Primarily, mountaintop removal is occurring in West Virginia, Kentucky, Virginia and Tennessee. Coal companies in Appalachia are increasingly using this method because it allows for almost complete recovery of coal seams while reducing the number of workers required to a fraction of what conventional methods require.
The US Environmental Protection Agency defines mountaintop removal as follows: “Mountaintop removal/valley fill is a mining practice where the tops of mountains are removed, exposing the seams of coal. Mountaintop removal can involve removing 500 feet or more of the summit to get at buried seams of coal. The earth from the mountaintop is then dumped in the neighbouring valleys.”
The process involves the clearing of the vegetation, the blasting of the mountain, the dumping of the debris in the valley, the pollution of water and land. A number of organizations and affected communities are fighting this type of destructive practice. Learn more on:
GIS events
ESRI European User Conference: 26-28 October 2011 - Madrid, Spain
Three days during which users can get updates on the latest GIS news in the ESRI world, attend useful technical workshops run by ESRI staff and hear how people are using GIS around the world in several fields. We will be there!
Italian GIS Conference ASITA: 15-18 November 2011 - Parma, Italy. Come to visit us!
ASITA, one of the biggest GIS appointments in Italy this time in our home town! Come to visit us, we will be at booth 14 available to start collaborative projects and offering specials on training and software, games and more!
Climate datasets

We remember the time when finding climate gridded dataset was very difficult. Nowadays some great websites provide direct download for detailed climate data for Europe and the World. We would like to present the European Climate Assessment & Dataset (ECA&D) project, WorldClimat.org and the Consortium for Spatial Information.
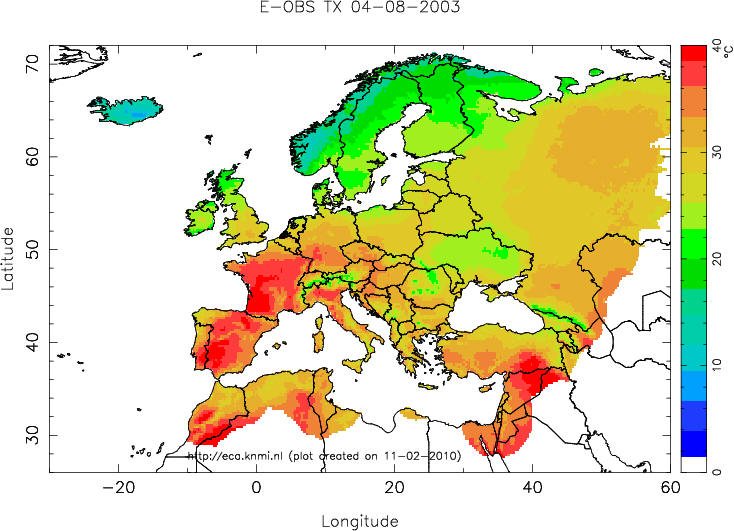
The European Climate Assessment & Dataset
ECA&D is receiving data from 56 participants for 63 countries and the ECA dataset contains 15953 series of observations for 12 elements at 3605 meteorological stations throughout Europe and the Mediterranean.
E-OBS is a daily gridded observational dataset for precipitation, temperature and sea level pressure in Europe based on ECA&D information. The full dataset covers the period 1950-2010. It has originally been developed as part of the ENSEMBLES project (EU-FP6) and is now maintained and elaborated as part of the EURO4M project (EU-FP7). The datafiles contain gridded data for 5 elements (daily mean temperature TG, daily minimum temperature TN, daily maximum temperature TX, daily precipitation sum RR and daily averaged sea level pressure PP). They cover the area: 25N-75N x 40W-75E. The data files are in compressed NetCDF format available on a 0.25 and 0.5 degree regular lat-lon grid, as well as on a 0.22 and 0.44 degree rotated pole grid.
WorldClim
WorldClim is a set of global climate layers (climate grids) with a spatial resolution of a square kilometer spanning a time period from 1950 to 2000. They can be used for mapping and spatial modeling in a GIS or other computer programs. The data layers were generated through interpolation of average monthly climate data from weather stations on a 30 arc-second resolution grid (often referred to as "1 km2" resolution). Variables included are monthly total precipitation, and monthly mean, minimum and maximum temperature, and 19 derived bioclimatic variables.
Consortium for Spatial Information
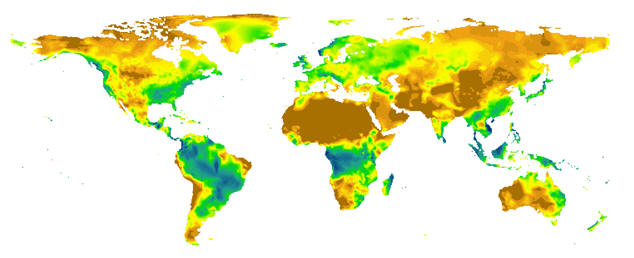
The fifteen international research centres belonging to the he Consultative Group for International Agriculture Research (CGIAR) have pioneered the application of Geographic Information Systems (GIS) and Remote Sensing (RS) for sustainable agricultural development for more than a decade. In May 1999, they formed the Consortium for Spatial Information (CGIAR-CSI) which links the CGIAR's GIS/RS laboratories, and the many geospatial scientists and researchers within the CGIAR system, with scientists and institutions from around the world. They have already developed important collections of data on population, poverty, climate, soils, crops, livestock, transportation, and biodiversity and other geospatial Global Public Goods.
We would like to mention their datasets on Global Potential Evapo-Transpiration (Global-PET) and Global Aridity Index providing high-resolution (~1km at equator) global raster climate data related to evapo-transpiration processes and rainfall deficit for potential vegetative growth, and the Global High-Resolution Soil-Water Balance dataset provides hydrological raster data (ESRI Grid format) describing actual evapo-transpiration and soil water deficit with resolution of 30 arc seconds (~1km at equator).
Mapping contamination from natural gas extraction
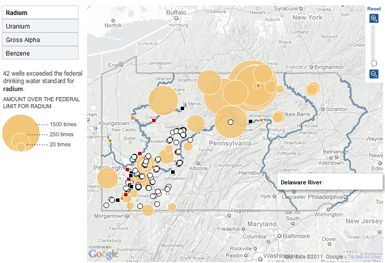
Western world addiction to energy consumption is pushing to exploit always more dangerous and more destructive energy sources. The increase of oil price due to the reduction of its available sources is making other sources financially competitive at high environmental and health cost.
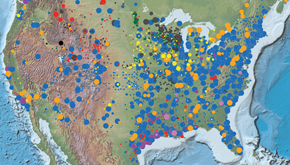
The American landscape is dotted with hundreds of thousands of new wells and drilling rigs, as the country scrambles to tap into this century’s gold rush for natural gas.
The New York Times collected data from more than 200 natural gas wells in Pennsylvania. Many of them are tapping into the Marcellus Shale, a vast underground rock formation. But a method being used to stimulate wells, called hydraulic fracturing, produces wastewater containing corrosive salts and radioactive and carcinogenic materials. In Pennsylvania, this wastewater has been sent through sewage treatment plants that cannot remove some of the contaminants before the water is discharged into rivers and streams that provide drinking water. The Times was able to map 149 of the wells. Coloured circles show the amount over federal limit for Radium, Uranium, Gross Alpha and Benzene.
The relatively new drilling method — known as high-volume horizontal hydraulic fracturing, or hydrofracking — carries significant environmental risks. It involves injecting huge amounts of water, mixed with sand and chemicals, at high pressures to break up rock formations and release the gas. With hydrofracking, a well can produce over a million gallons of wastewater that is often laced with highly corrosive salts, carcinogens like benzene and radioactive elements like radium, all of which can occur naturally thousands of feet underground. Other carcinogenic materials can be added to the wastewater by the chemicals used in the hydrofracking itself.
Sourced from the New York Times.
World nuclear power plants and associated risk
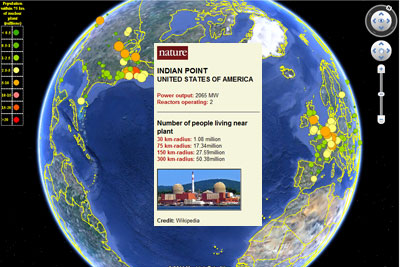
Following the Fukushima disaster several maps concerning nuclear energy have been produced over the web. Nature News and Columbia University have created an interactive Google Earth map and kml file showing the risk associated to nuclear plants around the world based on population density around the plants. Other factors are being assessed such as typology and age of the plant, external threats and culture. Information about each plant and a picture is also provided.
ArcGIS JavaScript APIs, how to refer to multiple dojo libraries
This technique is useful when you need to include more than one version of Dojo in the same page, for example perhaps you want to take advantage of features in a different version of dojo than the one included with the ArcGIS Server JavaScript API. To rename the namespace use djConfig.scopeMap to map dojo,dijit and dojox to different names, in this case esriDojo, esriDijit and esriDojox
djConfig = { scopeMap: [ [ "dojo", "esriDojo" ], [ "dijit", "esriDijit" ], [ "dojox", "esriDojox" ] ] };
After you rename the dojo namespace the ArcGIS Server JavaScript API will use the dojo version included with the API. Developers can use the ESRI version or load and use a different version of dojo for portions of the page. When you are working with ArcGIS Server JavaScript API code you will need to rename all references to dojo in your application to esriDojo. For example, rename dojo.addOnLoad to esriDojo.addOnLoad and dojo.require to esriDojo.require. However you don't need to change the module names passed to the require function i.e. esriDojo.require("dojo.number").
GIS for soil mapping and loss of topsoil

Loss of topsoil
In the last newsletter we talked about global warming. In this edition we would like to talk about another major global crisis that is drawing less attention than it deserves: the loss of topsoil. Topsoil is the upper layer of soil (5-20cm). It is the layer that has the highest concentration of organic matters and beneficial micro-organisms and insects at the base of plant nurturing and soil fertility.
Worldwide topsoil is being eroded and compromised at a much higher rate by human related practices that it can be generate by the very slow biological and geological processes. Major impacts of this phenomenon affects countries all over the world. Several are the causes at the base of topsoil loss including agricultural practices, urban development, overgrazing, deforestation and contamination by toxic chemicals.
Industrial agricultural practices including heavy machinery, tilling, extended irrigation, and use of chemical pesticides and fertilizers lead to erosion, compaction, salinization and loss of the beneficial living organisms at the base of soil fertility. Often soil degradation starts a chain of additional damages such as pollution for rivers and coastal waters and higher sensitivity to floods.
The world’s four top crop-producing areas (U.S.A., the countries of the former USSR, China and India) are all losing topsoil at an alarming rate of over 13 billion tons per year.
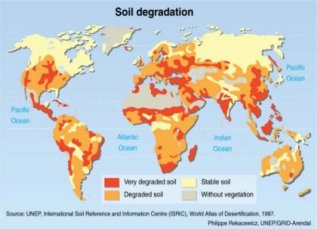
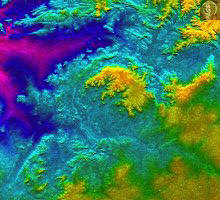
Soil degradation maps
The maps on the side depict soil degradation around the world, the first one showing the intensity of the damages and the second showing the cause. The map are from 1997, today situation is likely even worst.
Soil classification
Soil classification deals with the systematic categorization of soils using different criteria such as composition, forming processes, morphology and suitable use. Soils are usually divided into layers and topsoil is known as "A Horizon". Various classification systems are available such as the FAO and USDA soil classifications.
Soil GIS data
Data on worldwide soils can be downloaded in ArcGIS format from the World Soil Information foundation funded by the Netherlands Government:
http://www.isric.org/UK/About+Soils/Soil+data/Thematic+data/Soil+Geographic+Data/
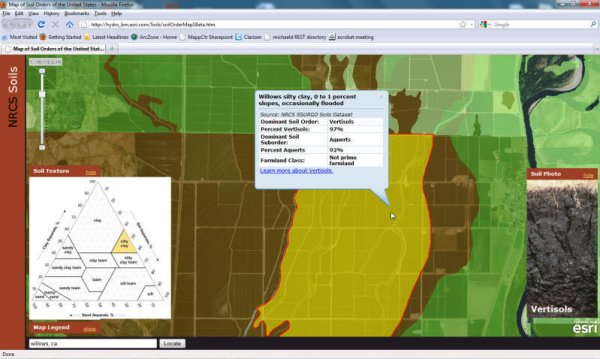
ESRI/NRCS soil web GIS application
ESRI in collaboration with the Natural Resources Conservation Service has recently released a web GIS application showing the distribution of the twelve soils orders of the USDA classification down to a detailed scale of 1:18000. A picture of each type of soil and a description of its properties are provided.
Digital Coast
Launched in 2008, the Digital Coast is a rich and dynamic website hosted by NOAA and used to address timely coastal issues. Website content is provided by numerous organizations and is continuously updated. It includes data, tools, training and case studies and it promotes collaboration among all actors involved in coastal areas management. Take a video tour of this useful website and consider the chance to contribute to it!
Data
The data sets represent some of the coastal data most requested by Digital
Coast partners. Access to data managed by the NOAA Coastal Services
Center is provided through the
Data Access Viewer, which allows for user-specified geographies,
formats, and resolutions. Other data sets are provided through various
mechanisms maintained by their agencies of responsibility.
Tools
The tools featured by the website support coastal decision-making
by transforming Digital Coast data into information tailored for specific
issues. Some tools are Web-based, providing direct online analysis and
viewing, while others are downloadable extensions that provide new functionality
for desktop geographic information systems.
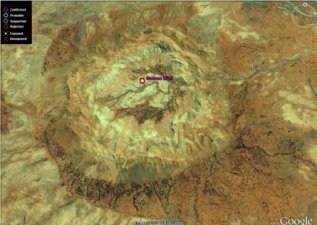
The impact crater database
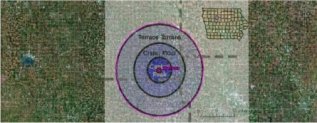
A very nice
KML file (Google Earth file format) displaying the location and
detailed information about several hundreds impact structures compiled
and made available by S. Levesque. The dataset includes confirmed, possible
and rejected locations. The first image on the side shows the location
and dimension of the non-exposed Manson crater featured in our "Where
is it" quiz of December!
Curios to see if there is an impact site not far from here you are located?
Check it out!
In most common usage, the term impact crater is used for the approximately circular depression in the surface of a planet, moon or other solid body in the Solar System, formed by the hypervelocity impact of a smaller body with the surface. Impact craters typically have raised rims and floors that are lower in elevation than the surrounding terrain. Meteor Crater (featured in the "Where is it?" quiz) is perhaps the best-known example of a small impact crater on the Earth.
Impact craters are the dominant landforms on many solid Solar System objects including the Moon, Mercury, Callisto, Ganymede and most small moons and asteroids. On other planets and moons that experience more-active surface geological processes, such as Earth, Venus, Mars, Europa, Io and Titan, visible impact craters are less common because they become eroded, buried or transformed by tectonics over time. Where such processes have destroyed most of the original crater topography, the terms impact structure or astrobleme are more commonly used.
In the early Solar System, rates of impact cratering were much higher than today. Currently the Earth experiences from one to three impacts large enough to produce a 20 km diameter crater about once every million years on average. This indicates that there should be far more relatively young craters on the planet than have been discovered so far.
Although the Earth’s active surface processes quickly destroy the impact record, about 170 terrestrial impact craters have been identified. These range in diameter from a few tens of meters up to about 300 km, and they range in age from recent times (e.g. the Sikhote-Alin craters in Russia whose creation were witnessed in 1947) to more than two billion years. (Source Wikipedia)
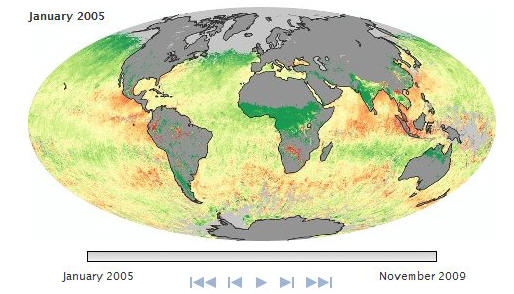
GlobCorine, Pan-European land cover and use map 2009
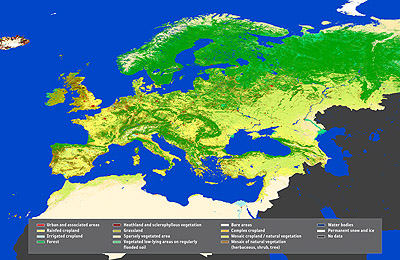
Last October the new land cover map for Europe was released. The map is based on ESA’s Envisat MERIS data from 1 January to 31 December 2009, is the first of its kind to be produced in such a short time – nine months as opposed to years of the previous Corine editions. GlobCorine shows how an automated service can generate and regularly update such maps, which are essential for environmental agencies. The map, providing a resolution of 300 m, was delivered to the European Environmental Agency (EEA), the project’s main user.
Data can be downloaded for free from: http://ionia1.esrin.esa.int/globcorine/
Using GIS to map the habitat of Snow Leopards
 Snow leopards, Panthera uncia, inhabit some of the most hostile, snow-swept
and least productive territories on the earth. Their population may
count as low as 3,500 individuals, spread in a dozen of countries in
South and Central Asia, from Nepal to Russia, an area of more than half
a million square miles. The Snow Leopard Conservancy is a non-profit
organization working with local people to solve the conflicts between
the agropastoral activities and this big cat with the purpose of protecting
this charismatic species and to find optimal livestock management practices
for the farmers.
The Snow Leopard Conservancy is using GIS to try to best estimate
Snow Leopard population and to identify and manage its habitat. Mappamondo
GIS adopted one of the cub identified by the camera trap. To support
and know more about the Snow Leopard Conservancy efforts
visit their website!
Snow leopards, Panthera uncia, inhabit some of the most hostile, snow-swept
and least productive territories on the earth. Their population may
count as low as 3,500 individuals, spread in a dozen of countries in
South and Central Asia, from Nepal to Russia, an area of more than half
a million square miles. The Snow Leopard Conservancy is a non-profit
organization working with local people to solve the conflicts between
the agropastoral activities and this big cat with the purpose of protecting
this charismatic species and to find optimal livestock management practices
for the farmers.
The Snow Leopard Conservancy is using GIS to try to best estimate
Snow Leopard population and to identify and manage its habitat. Mappamondo
GIS adopted one of the cub identified by the camera trap. To support
and know more about the Snow Leopard Conservancy efforts
visit their website!
2010 United Nations Climate Change Conference, Cancun Mexico and GIS for climate change
A bit of history
The 2010 United Nations Climate Change Conference was held from November 29th until December 10th in Cancun, Mexico. This conference represents the 16th yearly meeting (COP16) of world leaders that has been held since the establishment of the United Nations Framework Convention on Climate Change (UNFCCC). The UNFCCC is an international environmental treaty established during the Earth Summit of Rio De Janeiro in 1992 whose objective is to stabilize greenhouse gas concentrations in the atmosphere at a level that would prevent dangerous anthropogenic interference with the climate system.
The treaty itself set no mandatory limits on greenhouse gas emissions for individual countries and contains no enforcement mechanisms. In that sense, the treaty is considered legally non-binding. Instead, the treaty provides for updates (called "protocols") that would set mandatory emission limits. The principal update is the Kyoto Protocol established during the third yearly meeting (COP3) in 1997, which has become much better known than the UNFCCC itself. Most industrialized countries and some central European economies in transition (all defined as Annex B countries) agreed to legally binding reductions in greenhouse gas emissions of an average of 6 to 8% below 1990 levels between the years 2008–2012.
The recent conference in Cancun served also as the 6th meeting of the Parties (MOP6) to the Kyoto Protocol. Verifications of the Kyoto protocol targets will be done in 2013, current results are of mixed success and based on complex exchange mechanisms among countries. Last year COP15 meeting in Denmark was expected to establish an ambitious global climate agreement for the period from 2012 when the first commitment period under the Kyoto Protocol expires. However no legal-binding agreement was made with great disappointment from the scientific community. Again this year meeting did not produce any legal-binding agreement although a political agreement was made to limit global warming to less than 2 degrees Celsius above pre-industrial levels and a monetary fund was established to support actions. Scientists see this as a fair modest agreement as not sufficient to avoid dangerous climate change.
Hope is put for concrete measures to be agreed next year during the COP17.
Data overview
For a good overview of data showing evidence of anthropogenic global warming visit the NASA global climate change website.
GIS for climate change
The National Center for Atmospheric Research is hosting the Initiative Climate Change Scenarios GIS data portal. This portal is intended to serve a community of GIS users interested in climate change. The free datasets of climate change projections can be viewed on-line and/or downloaded in a common GIS (shapefile) or text file format. Many 2D variables from modeled projected climate are available for the atmosphere and land surface. These climate change projections were generated by the NCAR Community Climate System Model, or CCSM, for the 4th Assessment Report of the Intergovernmental Panel on Climate Change (IPCC).
ESRI has set up a website area dedicate to GIS for climate change where several resources are available including e-books with case studies concerning the use of GIS for renewable energy, carbon management, land change studies, climate modelling, ice cover studies and more. A carbon footprint data model is also under development.
The living planet 2010
Humanity is now using nature's services 50 percent faster than what Earth can renew, reveals the 2010 Living Planet Report, released Oct. 13 in Bristol, UK. Produced by WWF in collaboration with Global Footprint Network and the Zoological Society of London, the report examines the state of our natural world, and our impacts upon it.
By 2030 humanity will need the capacity of two Earths to absorb carbon dioxide waste and keep up with natural resource consumption.
A very interesting atlas of maps showing information on biocapacity, consumption and production per country was also produced.
Hungary toxic sludge, satellite images available as KML files
Another major environmental disaster has hit the world, this time in Europe.
GeoEye made available Ikonos images of the recent toxic sludge spill in Hungary. See the below screen shots for before/after images; you can also view the the imagery in Google Earth using this KML overlay. Image credits Digital Globe (before) and GeoEye (after).
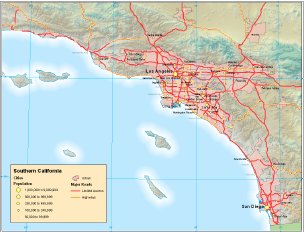
Maps usually show Europe as a group of countries surrounded by the seas. They focus on cities, roads and landscapes – the seas fall into the background. The new European Atlas of the Seas hosted by the European Commission takes the opposite perspective: it puts the seas and all their different uses in the foreground.
We found of particular interest the visualization of data concerning fishery activities such as fishing zones, quotas, catches and vessels.
ESRI Europe, Middle East and Africa User Conference (EMEA UC)

This year the Europe, Middle East and Africa User Conference (EMEA UC) will be held in Rome on October 26–28.
E-book: Geographic Technologies applied to Marine Spatial Planning and Integrated Coastal Zone Management
This free e-book , kindly made available by a team of researchers at the University of Azores, is an up to date collection of scientific papers concerning the use of GIS and Remote Sensing technologies to support ecosystem based management within several marine sectors and themes.The North American Environmental Atlas
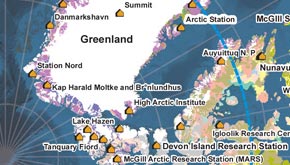
The North American Environmental Atlas represents an effort between Canada, USA and Mexico to harmonize geographic information across North America's political boundaries to depict significant environmental issues at a continental scale.
The website offers a state of the art data access gateway with easy data download in several formats (such as shapefile, grids, GeoPDF, KML etc) as well as ArcGIS project files including symbology (.mxd and layer packages). The online map viewers features an online Google Earth 3D viewer.
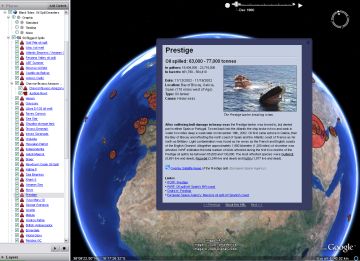
Black tides: The worst oil spills disasters
 This
KML file designed by David Tryse shows information about the 50 worst
oil spills since 1960, from tanker accidents and drilling operations,
as well as a number of other notable spills. You can open the file in
Google Earth by clicking the above link.
This
KML file designed by David Tryse shows information about the 50 worst
oil spills since 1960, from tanker accidents and drilling operations,
as well as a number of other notable spills. You can open the file in
Google Earth by clicking the above link.Matthew Baker compiled this map using various sources of data showing the current oil spill and the system of pipelines and platforms present in the Gulf of Mexico.
This site hosted by Google Crisis Response provides, beside the current area concerned by the oil spill, a 24, 48 and 72 hours forecast as well as all available satellite images since the spill occurred (MODIS, ENVISAT Radar and NOAA Aerial photography). All data can be downloaded in KML format.
Alarming is the counter of the estimated gallon leaked.
Tree cover distribution maps for Europe
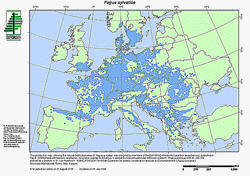
A great free data source for those needing data on tree cover. The distribution maps available from this website were produced by members of the EUFORGEN Networks and other experts, based on existing bibliography and other information sources. EUFORGEN is a collaborative programme among European countries to promote conservation and sustainable use of forest genetic resources. It serves as a platform for pan-European collaboration in this area, bringing together scientists, managers, policy-makers and other stakeholders. Distribution maps can be downloaded in PDF, JPG or SHAPEFILE (in Lambert Azimuthal equal-area projection) formats. The maps are updated as soon as new information is available.
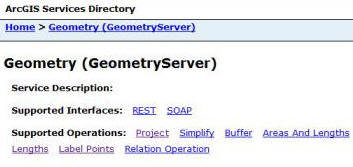
ArcGIS Server Geometry Service
This is one of the most useful and revolutionary ArcGIS Server Online services made available for free by ESRI. The geometry (web) service, introduced with ArcGIS Server 9.3, provides geometric calculations such as buffering, simplifying, calculating areas and lengths, projecting and queries based on spatial relationships among features (intersection, containment etc). The geometry service can be exploited easily by applications built with the ArcGIS REST or JavaScript APIs. This line creates the geometry service:
gsvc = new esri.tasks.GeometryService("http://sampleserver1a.arcgisonline.com/arcgis/rest/services/Geometry/GeometryServer");
To use one of the functionality offered by the service it is sufficient to provide the required parameters and a callback function to retrieve and display the results on the web map, for example:
gsvc.buffer(params, showBuffer);
Complete samples are available on the ArcGIS Server Java Script APIs Resource Center, and here a live sample.
Fishery Analyst Online at the ESRI 2010 Mashup Challenge!
With the theme Map Your App, ESRI’s 2010 Mashup Challenge invites members of the geodeveloper community to stretch their imaginations, test their technical skills, and develop creative geospatial Web applications.
We invite you to have a look to our entry for this fun and interesting contest in this 5 minutes video!
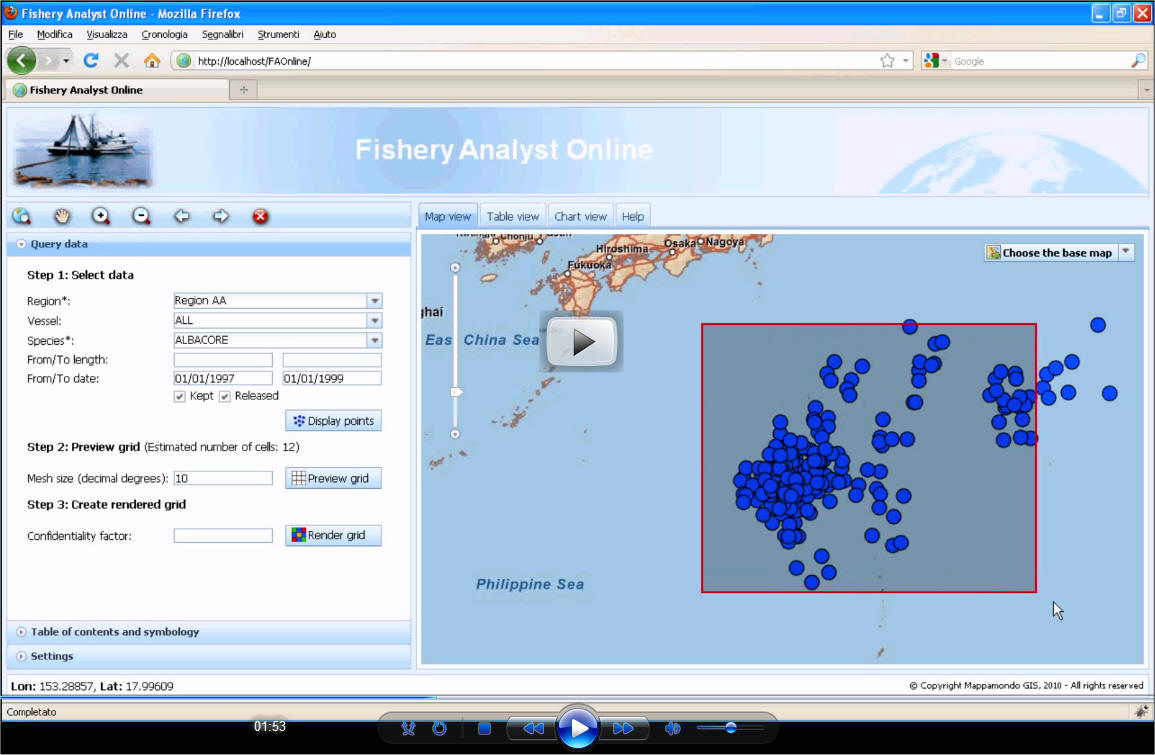
Fishery Analyst Online is a web GIS application aiming to effectively query fishery data, analyze and visualize temporal and spatial patterns of fishery dynamics. The main functions are quantitative estimation and visualization of catch, effort, fishing success and their variation in space and time. It also provides a mean for analysing fishing vessel utilization, data quality control, and deriving information on the location of important economic and threatened species.
It was developed using the ArcGIS Server Java Script APIs, the Dojo framework and Google Chart APIs.
The application was born as a web evolution of the successful ArcGIS Desktop Fishery Analyst application developed by the same author.
The online version aims to take advantage of the new web and server based technologies provided by ESRI and the web in general offering improved accessibility, data sharing, integration, centralization and resources optimization beside new functionalities.
Institutions such as national, federal and international agencies and universities working in the domain of fishery science and management will benefit from this application.
To know more please write to us!
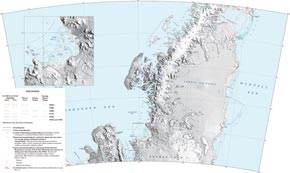
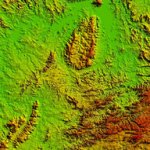
The World Digital Elevation Models
A few ambitious projects have attempted to provide a global Digital Elevation Model for the earth surface. The good news is that data are freely available and constantly improving! Follow the hyperlinks to access data download sites.
GTOPO30
One of the first available and widely utilized world DEM was the GTOPO30 (resolution at 30 arcsecond, about 1Km). Its quality is variable and in some areas it is very poor but it has been one of the first products providing such an extensive coverage at a relatively /for its time) high resolution. GTOPO30 was derived from several raster and vector sources of topographic information.
The Shuttle Radar Topography Mission (SRTM)
The Shuttle Radar Topography Mission (SRTM) obtained elevation data on a near-global scale to generate the most complete high-resolution digital topographic database of Earth. Available resolution is 30 meters for the USA and 90 meters for the rest of the world. SRTM consisted of a specially modified radar system that flew onboard the Space Shuttle Endeavour during an 11-day mission in February of 2000. SRTM is an international project spearheaded by the National Geospatial-Intelligence Agency (NGA) and the National Aeronautics and Space Administration (NASA). Several years are required to process the large amount of data and various versions of the dataset were developed with improving accuracy. Version 4 of this dataset was released in August 2009 by the Consortium for Spatial Information (CGIAR-CSI) and it is probably the best world DEM currently available.
Advanced Spaceborne Thermal Emission and Reflection Radiometer (ASTER)
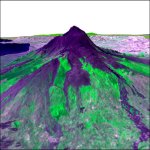
A new high resolution DEM developed from data acquired by the Advanced Spaceborne Thermal Emission and Reflection Radiometer (ASTER) instrument of the Terra satellite is also now freely available for 99% of the globe, and represents elevation at a 30 meter resolution. The dataset was reaese on June 2009. Despite the high nominal resolution, METI and NASA pointed out that the current version of the GDEM product is "research grade" thus major inaccuracy are expected to be still present in the data. The GDEM is available for download from NASA's EOS data archive and Japan's Ground Data System
Further information
The limitation with the GTOPO30 and SRTM datasets is that they cover continental landmasses only, and SRTM does not cover the polar regions and has mountain and desert no data (void) areas. SRTM data, being derived from radar, represents the elevation of the first-reflected surface — quite often tree tops. So, the data are not necessarily representative of the ground surface, but the top of whatever is first encountered by the radar. Submarine elevation (known as bathymetry) data is generated using ship-mounted depth soundings. The SRTM30Plus dataset (used in NASA World Wind) attempts to combine GTOPO30, SRTM and bathymetric data to produce a truly global elevation model. New versions of the SRTM are aiming to improve the quality of the dataset by removing artefacts, filling data gaps using interpolation techniques and applying various type of corrections.
Many national mapping agencies produce their own DEMs, often of a higher resolution and quality, but frequently these have to be purchased, and the cost is usually prohibitive to all except public authorities and large corporations. USGS produces high resolution and more accurate DEMs for the USA.
Free DEMs are also available for Mars: the MEGDR, or Mission Experiment Gridded Data Record, from the Mars Global Surveyor's Mars Orbiter Laser Altimeter (MOLA) instrument; and NASA's Mars Digital Terrain Model (DTM)
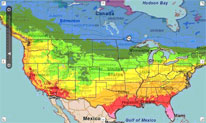
ArcGIS Online
If you need DEMs as base layers you can surely take advantages of the elevation map services made available for free by ESRI through ArcGIS Online.
Let's warm our new website!
We have redesigned our website hoping to provide better and easy to access content! Do not hesitate to contact us with suggestions or comments about the website and of course enquiries about our products, training and services. Feel free to shop at our new PayPal enabled online store, to subscribe to our periodic e-newsletter or our rss feed, to read about Conservation GIS programs and actions, to challenge your geography knowledge with our geo-quiz "Where is it?", or to stay up to date with news and technical tips reading our blog!

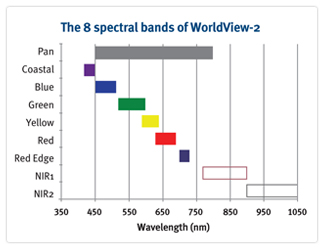
WorldView-2 high resolution imagery improves ocean monitoring by remote sensing
WorldView-2 will provide the only high resolution
8-band multispectral commercial satellite imagery available. Along with
the four typical multispectral bands: Blue (450-510), Green (510-580),
Red (630-690) and NearIR (770-895), WorldView-2 is introducing the following
new color bands for enhanced multispectral analysis:
Coastal Band (400 - 450 nm):
This band supports vegetation identification and analysis, and supports
bathymetric studies based upon its chlorophyll and water penetration
characteristics. Also, this band is subject to atmospheric scattering
and will be used to investigate atmospheric correction techniques.
Yellow Band (585 - 625 nm):
Used to identify "yellow-ness" characteristics of targets, important
for vegetation applications. Also, this band will assist in the development
of "true-color" hue correction for human vision representation.
Red Edge Band (705 - 745 nm):
Aids in the analysis of vegetative condition. Directly related to plant
health revealed through chlorophyll production.
Near Infrared 2 Band (860 - 1040 nm):
This band overlaps the NIR 1 band but is less affected by atmospheric
influence. It supports vegetation analysis and biomass studies.
Read more!
The Copenhagen diagnosis: Climate Science Report
 As
anybody concerned about the environment and sustainability of our actions
we are awaiting for the
United Nations Climate Change Conference, that will be held in Copenhagen
from the 7th to the 18th December.
As
anybody concerned about the environment and sustainability of our actions
we are awaiting for the
United Nations Climate Change Conference, that will be held in Copenhagen
from the 7th to the 18th December.
It is more than three years since the drafting of text was completed for the Intergovernmental Panel on Climate Change (IPCC) Fourth Assessment Report (AR4). In the meantime, many hundreds of papers have been published on a suite of topics related to human-induced climate change. The purpose of this report is to synthesize the most policy-relevant climate science published since the close-off of material for the last IPCC report. The rationale is two-fold. First, this report serves as an interim evaluation of the evolving science midway through an IPCC cycle - IPCC AR5 is not due for completion until 2013. Second, and most important, the report serves as a handbook of science updates that supplements the IPCC AR4 in time for Copenhagen in December 2009, and any national or international climate change policy negotiations that follow.
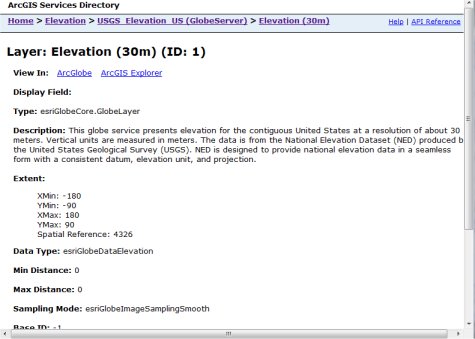
ArcGIS Server Services Directory and REST APIs
Services Directory is a very important part of ArcGIS Server installation and feature for developers that need to access information about the available services.
The default start URL to access the Service Directory for an ArcGIS Server installation is:
* Java: http://host:8399/argis/rest
* .NET: http://host/arcgis/rest
The REST API supports an admin console. The most useful operation to perfrom through it is the clear cache option that refreshes Services Directory information when updating services on your server (it is not done automatically!)
Assuming a default installation, the admin console is available at the following URLs:
* Java Server: http://host:8399/arcgis/rest/admin
*.NET Server: http://host/arcgis/rest/admin
Services Directory allows you to browse the contents of an ArcGIS Server and obtain information that can be useful to you when developing applications. Services Directory is a view of the ArcGIS Server REST API in HTML format. Each ArcGIS Server instance has Services Directory installed during the installation process. Services Directory helps you do these things:
* Browse the contents of the GIS server and get service level metadata You can navigate a series of links to view information about the services on your GIS server. The links also allow you to preview how your service looks in ArcMap, in a Web browser, in Google Earth, and so on.
* Get information to help you develop applications When you develop applications with the JavaScript APIs you must provide URLs to services and the layers and functionality they expose. Services Directory provides an interactive way for you to construct those URLs. Services Directory works using REST.
REST is an architectural style that allows ArcGIS Server to reveal a hierarchy of information about itself through endpoints, or URLs. When you use Services Directory, you navigate through a series of links to discover information about the server. Every time you click a link, you see a new page that reveals additional information about what's available on the server. The information that you see on the page was retrieved through REST using the page's URL.
If you wish to use the REST APIs in your application, have a look to the online Getting Stared guide and learn how to construct requests and get responses through URLs:
http://resources.esri.com/help/9.3/arcgisserver/apis/rest/index.html
ArcGIS Server 9.3 JavaScript APIs
Building ArcGIS Server based web GIS application has never been so easy! We will come on this subject more in details in the future, for now just a brief overview:
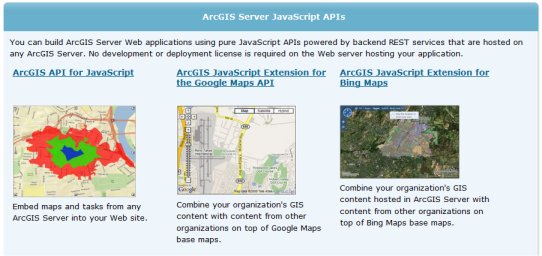
The ArcGIS API for JavaScript™ (JavaScript API) is a browser based API for developing high performance, easy to use mapping applications. The API allows you to easily embed maps in your Web pages. The JavaScript API is hosted by ESRI on ArcGIS Online.
If you are just getting started, you can learn about using the JavaScript API to create a map or task.
You can also take a look at the samples. Many samples are available that show some aspect of the JavaScript API. Most samples are a complete Web page, and you can view both the code and the page display.
The ArcGIS JavaScript API Reference is also available if you need more information about each object and its properties, methods, and events.
Script: Import bookmarks
This script allows to import bookmarks from one mxd project to another one. Paste this code in the destination mxd ThisDocument code file (under Tools/Macros/Visual Basic Editor) and link it to a button on the ArcMap toolbar.
PS: Since ArcGIS 9.3 this functionality is built in in ArcMap. You can save to file the bookmarks in your origin mxd by going under Bookmarks/Manage save and then load them in the destination mxd going under Bookmarks/Manage/Load...
Script: 5 digits precision coordinates in ArcMap status bar
Copy and paste the following code in the ArcMap VB Editor (Tools/Macros/Visual Basic Editor) ThisDocument under the Project or Normal template and run it to have the map coordinates of the mouse pointer displayed in the status bar with 5 digits after the comma:
Sub UpgradeDigits()
Dim pDoc As IMxDocument
Dim pRepUnit As IReportUnitFormat
Dim pNumericFormat As INumericFormat
Set pDoc = ThisDocument
Set pRepUnit = pDoc
Set pNumericFormat = New NumericFormat
With pNumericFormat
.AlignmentOption = esriAlignRight
.RoundingOption = esriRoundNumberOfDecimals
.AlignmentWidth = 15
.RoundingValue = 5
.ShowPlusSign = False
.UseSeparator = True
.ZeroPad = False
End With
Set pRepUnit.NumericFormat = pNumericFormat
End Sub
Live ESRI training on ArcGIS Server 9.3 security
The 9.3 release of ArcGIS Server for the Java Platform implements a role-based security model that allows you to define a set of users, assign permissions to them based on the role they assume, and grant access to GIS services and Web applications. To simplify the task of protecting your GIS resources, ArcGIS Server Manager now provides a rich UI experience for configuring Java EE security on your hosted GIS services and the Web applications that use them.
This seminar introduces the new Server Manager options for configuring security. The presenter demonstrates the GUI-driven workflow for implementing security for GIS services and client Web applications. You will also learn about the new token service option that provides an embedded security solution.
The presenter discusses:
Watch the recorded seminar at: http://training.esri.com/acb2000/showdetl.cfm?did=6&Product_id=932
ESRI Europe, Middle East and Africa User Conference 2008: meet us in London!
 The
EMEA UC 2008 is a three day conference and will reflect ESRI and ESRI
(UK)’s vision for the future where GIS solutions will play an increasingly
vital role on an everyday basis in a myriad of different ways.
The
EMEA UC 2008 is a three day conference and will reflect ESRI and ESRI
(UK)’s vision for the future where GIS solutions will play an increasingly
vital role on an everyday basis in a myriad of different ways.
The EMEA UC 2008 attendees will include everyone interested in learning more about how GIS is impacting on everyday life - GIS Users, GIS Managers, Developers, System Architects and IT Professionals, technical software users and key decision makers. The audience will also include partners, customers, industry analysts and media partners. Delegates will represent a wide range of industries including Central Government, Local Government, Defence, Education, Environment, Health, Private Sector, Public Safety and Utilities organisations.
The 2008 Conference promises to be a ‘must attend’ event for everyone interested in learning more about how GIS is impacting everyday life. Download here the conference brochure and agenda: http://www.gisforeverydaylife.com/gisforeverydaylife.pdf
Technology: ESRI’s New ArcGIS API for Flex
ESRI announced the new ArcGIS API for Flex Beta at the ESRI International User Conference in San Diego, California, which was held August 4–8, 2008.
ArcGIS API for Flex is integrated with Adobe Flex Builder 3 and can be downloaded for free from ESRI. Flex is a client-side technology that is rendered by Flash Player 9 or Adobe AIR. This means that application developers now have the capability to combine geographic information system (GIS)-based Web services from ArcGIS Server with other Web content and display it in fast, visually rich, and expressive mapping applications that can be deployed over the Web or to the desktop.
ArcGIS API for Flex takes full advantage of the powerful mapping, geocoding, and geoprocessing capabilities of ArcGIS services. Application end users can display their local data in an interactive map, search for and display GIS data features and attributes, locate addresses, identify features, and perform complex spatial analytics by simply clicking a button or on the map.
Developers can program with ArcGIS API for Flex without installing ArcGIS Server on their machine as long as they have access to ArcGIS Server via a URL. Because the API is built on the Adobe Flex framework, developers can incorporate Flex components, such as data grid, trees, panels, and charts, into custom applications.
To know more about ArcGIS Server API for Flex: http://resources.esri.com/arcgisserver/apis/flex/
To know more about FLEX: http://www.adobe.com/products/flex/
The website: Solar Boston
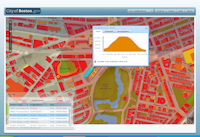 In June 2007, the City of Boston became one of thirteen inaugural Solar
America Cities under the
Solar America Initiative of the U.S. Department of Energy (DOE)
and launched Solar Boston, a half-million-dollar program to encourage
widespread adoption of solar energy in Boston .
In June 2007, the City of Boston became one of thirteen inaugural Solar
America Cities under the
Solar America Initiative of the U.S. Department of Energy (DOE)
and launched Solar Boston, a half-million-dollar program to encourage
widespread adoption of solar energy in Boston .
The Solar Boston map allows you to see active renewable energy installations within the City, and to calculate the solar potential of building rooftops. The map was created by the Boston Redevelopment Authority in cooperation with the Solar Boston program. To view the map: http://gis.cityofboston.gov/solarboston/
Video tutorial (15min): What's new in ArcGIS 9.3"
The video will guide you through the major new features of ArcGIS Desktop 9.3 including better options for bookmarks management, labeling, graphic object conversion, klm support, editing and geoprocessing.
http://www.esri.com/flashmedia/arcgis_desktop_93/arcgis_desktop_93.html
ArcPhoto
The ArcPhoto Tools are a set of geoprocessing tools and ArcMap user interface enhancements to enable the quick import of digital photography into the ArcGIS framework. The tools work directly off the EXIF (Exchangeable image file format) header information that is encoded into digital imagery. Read more about and download this free tool from the ArcScripts website:
The Task Framework in ArcGIS Server
Tasks are functional units that accomplish a business operation in your application. The task framework provides an easy and systematic way of writing and executing custom tasks. The framework is versatile enough to generate the metadata for your tasks providing the relevant html elements necessary to interact with the task. This enables you to concentrate just on the functionality you are implementing. It also provides a way to specify custom metadata information to have control over fine grained details like using images for buttons and choosing different layouts for your task inputs. Read more about the Java and .NET task framework...
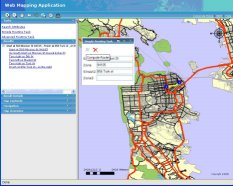
 ArcGIS Server 9.2 Web Mapping Application Compared to ArcIMS 9.2 Viewers.
This new white paper compares and discusses the tools and tasks provided in the ArcGIS Server 9.2 Web Mapping Application and ArcIMS 9.2 Viewers. The paper provides insight on how to customize and maximize each application.
Atlas of Our Changing Environment
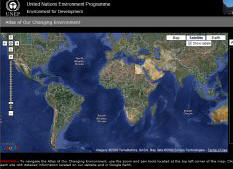 Through illustrations, satellite images, ground photographs and powered
by Google Maps, this interactive
media depicts and describes humanity's past and present impact on the
environment. The primary focus is on environmental status and trends
over the last 30 years, in terms of both physical and human geography.
Through illustrations, satellite images, ground photographs and powered
by Google Maps, this interactive
media depicts and describes humanity's past and present impact on the
environment. The primary focus is on environmental status and trends
over the last 30 years, in terms of both physical and human geography.
Geodatabase Spatial Domain Calculator
This free and useful tool is a standalone ArcGIS Engine application that allows the user to configure the domain settings for a geodatabase.
Here the second chapter about managing your raster data in ArcSDE geodatabases. The document explains how ArcSDE provides efficient storage and retrieval of raster data in a client/server environment. Where possible, best practices for the loading, storage, and retrieval of raster layers are given.
This tool allows the user to choose a layer in the table of contents and interactively select multiple fields to delete all at the same time.
What is versioning and how to implement it in a geodatabase.
Multiuser geodatabase editing is supported by versioning. This technical paper discusses the practice and principles of versioning, editing a versioned geodatabase, reconciling versions, conflict detection, posting versions, special reconcile cases, and version administration.
Have you ever wondered how to convert contour lines to a DEM? Topo to Ratser is the tool you are searching for, available with Spatial Analyst starting at ArcGIS 9!
Topo to Raster is an interpolation method specifically designed for the creation of hydrologically correct digital elevation models (DEMs). It is based on the ANUDEM program developed by Michael Hutchinson (1988, 1989).
See Hutchinson and Dowling (1991) for an example of a substantial application of ANUDEM and for additional associated references. A brief summary of ANUDEM and some applications are given in Hutchinson (1993). The version of ANUDEM used is 4.6.3.
Topo to Raster is the ArcGIS 9.x implementation of TopoGrid from ArcInfo Workstation 7.x.
ArcGIS 9.x ECW JPEG 2000 plugin
This ArcGIS extension allows for displaying raster images in the ECW JPEG 2000, URL, ALG, ERS formats and provide the ECW JPEG 2000 compressor.
Designing Interactive ArcGlobe documents
Tricks, best practices and hardware tips to create great 3D animations in ArcGlobe.
This tool allows to save a graphic (line, point, polygon) drawn in ArcMap Data View in a shapefile
Creating coastal vignettes with vector and raster methods
Some cartographic trick to represent on a map the areas where land and sea meet.
Representing where land and water meet can be done using a number of methods, some of which are called coastal vignettes. Coastal vignettes symbolize the water from the shoreline towards open water. A vignette is usually thought of as a drawing (i.e., symbolized graphic mark) that gradually fades into the surrounding background leaving an undefined edge.
If you liked ESA website you can not miss NASA website on earth observations.
The Earth Observatory’s mission is to share with the public the images, stories, and discoveries about climate and the environment that emerge from NASA research, including its satellite missions, in-the-field research, and climate models.
Managing a raster database: best-practices, scripts and case studies.
This document guides you through the setup, maintenance, and backup of a raster database. These management tasks are presented using a case study approach employing scenarios to illustrate the challenges faced by a geographic information system (GIS) team. Each scenario will describe a problem to solve, the logistics involved, and the choices made by various GIS team members.
Using Structured Query Language (SQL) to query a geodatabase
Feature classes and tables in a geodatabase can be queried and modified using SQL. This technical paper discusses SQL and the geodatabase, how to query and edit a geodatabase using SQL, multiversioned views, and version reconcile, as an alternative approach to managing the geodatabase using ArcGIS.
A simple but efficient and useful tool to repair corrupted shapefiles
ESA Observing the Earth website
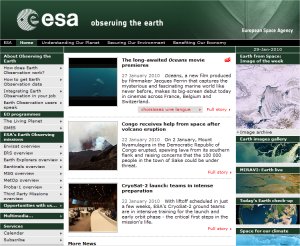
For those passionate about remote sensing a great website from the European Space Agency (ESA) rich of earth observation programs, images and applications.
Satellites show the world through a wide-enough frame so that complete large-scale phenomena can be observed to an entirety it would take an army of ground-based observers to match. Whether on global, regional or local scales, space information can make a valuable contribution to not just scientific comprehension but also our quality of life. It is a way to more effectively understand the Earth system – which in turn means we can better secure our environment and benefit all those living within it.
All you wanted to know about shapefiles!
This document defines the shapefile (.shp) spatial data format. It lists the tools available in Environmental Systems Research Institute, Inc. (ESRI), software for creating shapefiles directly or converting data into shapefiles from other formats. This document also provides all the technical information necessary for writing a computer program to create shapefiles without the use of ESRI® software for organizations that want to write their own data translators.
ArcObjects Table of Content control
A very useful free tool for GIS developers offering a TOC object that allows to visualize or hide layers in the map and to manage symbology.
European register of emissions
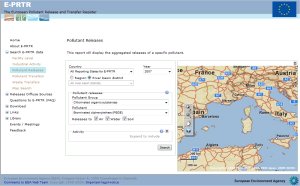
The European Pollutant Release and Transfer Register (E-PRTR) is the new Europe-wide register that provides easily accessible key environmental data from over 10.000 industrial facilities in European Union Member States and in Iceland, Liechtenstein and Norway.
Miscellaneous
Email info@mappamondogis.com with questions or comments about this web site.
Copyright © 2005-2010 Mappamondo GIS
VAT 02375720345 - Ph +39 02 899 26 8 26
![]()
![]()