| Mappamondo GIS Newsletter - N°35 December 2012 |
|
Welcome to the December 2012 edition! In this newsletter you will find
announcements about news, training opportunities, new products, jobs, technical
tips and links to resources concerning Geographic Information Systems (GIS)
and Remote Sensing. Don't miss the monthly quiz with prizes!
If this email doesn't display correctly you can visualize it
online here.
Featured this month:
- Events: Fishery Analyst now online at the Virginia
Institute of Marine Science!
- The map: Where minerals are
- The data source: MODIS Vegetation Continuous Fields
- The image: Superstorm Sandy: interactive before
and after images
- Quiz: where is it?
- Training: Not only GIS: What is
sustainability?
- Job opportunities:
- Geospatial scientist - Toliara, Madagascar
- Ocean Ecology Laboratory Chief - Greenbelt, Maryland - USA
Software trial available for download and other products:
-
Fishery
Analyst V2, GeoDB Loader, GPX converter, PANDA, Fishery Analyst Online
-
Book: Advanced Manual for ArcGIS 9 and 10. Building GIS models with
the ModelBuilder (Italian only)
-
Data collection: Customizable Mediterranean fauna
and flora identification cards
|
| Fishery Analyst now online at the Virginia Institute
of Marine Science! |
|
In the interest of dissemination of data products to fisheries
management agencies, the fishing community, and the general public
the Multispecies Research Group of The Virginia Marine Institute
of Marine Science is now providing online access to catch data via
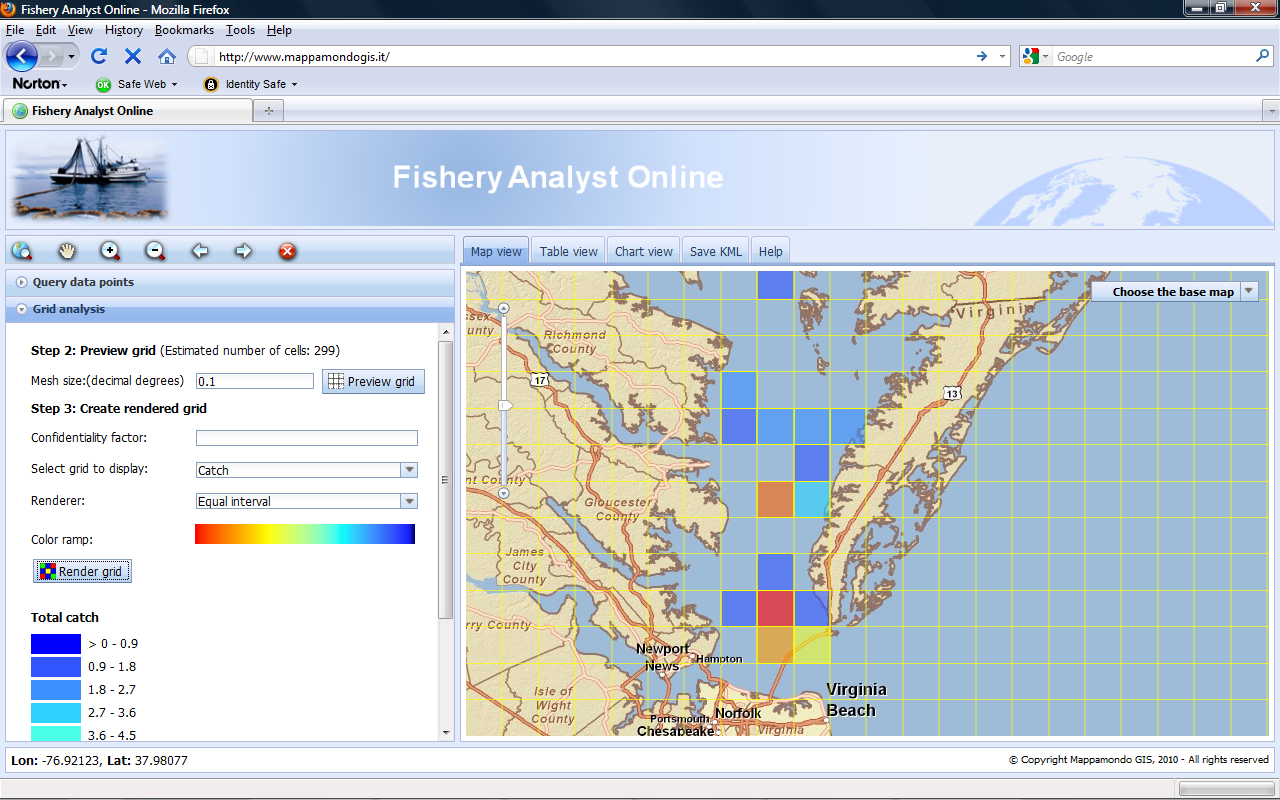
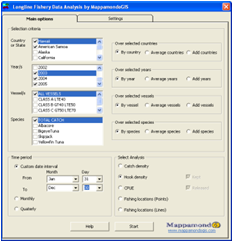
an interactive mapping application,
Fishery
Analyst Online (FAO).
The web GIS application allows querying the catch data based
on species, date, individual length, sex, maturity stage, disease
and displaying information about the number of individual caught
or the total biomass. Point data can be aggregated in grids of a
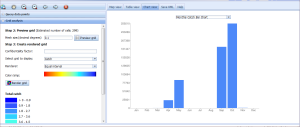
user defined size. Charts displaying catch by state, research cruise,
month and length-frequency histograms are also generated.
Currently available data are being collected under the Chesapeake
Bay Multispecies Monitoring and Assessment Program, ChesMMAP started
in 2002 and the NorthEast Area Monitoring and Assessment Program,
NEAMAP started in 2006.
These programs were developed to assist in filling data gaps,
and ultimately to support stock-assessment modeling activities at
both single and multispecies scales, maximize the biological and
ecological information collected for several recreationally, commercially,
and ecologically important species and to quantify geographic and
seasonal distribution of these species.
To access the web GIS application visit the
VIMS website:
|
|
|
| Map of the month: Where minerals are |
|
We have already mentioned the issue of peak conventional oil,
but oil is not the only non renewable resource we are consuming
at ever increasing rate disregarding the fact that we live in a
finite planet with finite resources.
Armin Reller, a materials chemist at the University of Augsburg
in Germany, and his colleagues are among the few groups who have
been investigating the availability of metals and the data they
provide highlights the need to re-think technology and consumption.
He estimates that we have about 10 years before we run out
of viable indium, extensively used in making flat screen TVs. Its impending
scarcity could already be reflected in its price: in January 2003
the metal sold for around $60 per kilogram; by August 2006 the price
had shot up to over $1000 per kilogram.
The same goes for many other rare or becoming "rare" metals such as platinum, tantalum,
antimony and even the more common zinc, copper, nickel and the
phosphorus used as fertiliser. Many renewable sources of energy
rely on the availability of some of these minerals including fuel
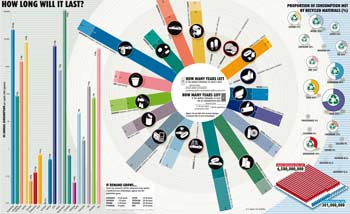
cells, solar panels and wind turbines. So just what proportion of
these materials have we used up so far, and how much is there left
to go round? Getting the exact number is not easy as both annual
global consumption and extractable amounts can only be estimated.
But the best estimates made with available information by this group
of scientists should have drawn some attention.
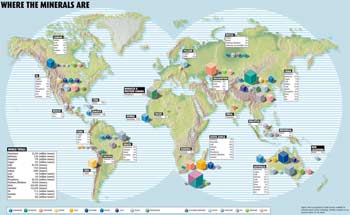
We here feature a map showing where the main reserves of minerals
are located around the world together with the consumption rate
by average western citizen and estimated time it will take for the
reserve to run out. Resources grabbing has always been at the base
of most political tensions and wars.
Read more here
|
|
| Data source: MODIS Vegetation Continuous Fields and improved
land-water mask |
|
The Vegetation Continuous Fields dataset provides proportional
estimates for vegetative cover types: woody vegetation, herbaceous
vegetation, and bare ground as a 250 meters resolution grid.
The product is derived from all seven bands of the MODerate-resolution
Imaging Spectroradiometer (MODIS) sensor onboard NASA's Terra satellite.
The continuous classification scheme of the VCF product may describe
areas of heterogeneous land cover better than traditional discrete
classification schemes.
While traditional classification schemes indicate where land
cover types are, this VCF product is great for showing how much
of a land cover such as "forest" or "grassland" exists anywhere
on a land surface.
Concurrently to the above product, a Global land water mask was
created at 250m spatial resolution and released on August 2009.
It was generated from remotely sensed data from the Shuttle Radar
Topography Mission (SRTM) and data from the MODIS instrument. It
represents a vast improvement over the 1km spatial resolution product
that proceeded it as it corrects numerous errors in locations of
rivers and identifies whole new landscapes of small lakes in the
far North.
To download the dataset visit the
Global Land Facility
website.
|
|
|
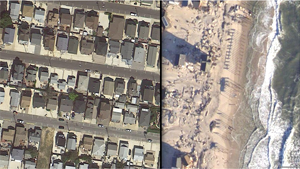
| The image: Superstorm Sandy's interactive
before and after images |
|
Dramatic interactive satellite images to see parts of the north-eastern
coastline of the United States before and after the damage caused
by Hurricane Sandy were produced by a NOAA and Google collaboration
and are available on the
ABC news site.
You can hover over each satellite photo to view the before and
after comparison.
|
|
|
| Training, not only GIS: What is sustainability?
|
|
To contribute to its environmental commitment Mappamondo GIS has run
in 2012 a series of free seminars on sustainability in the "World
Café" open format.
We covered subjects such as natural resources availability, peak
conventional oil, energy sources and EROEI (Energy Returned On Energy
Invested), the ecological and carbon footprints, fundamental human
needs, system resilience, programmed obsolescence, limits of the
growth economic model and the GDP index, green washing, industrial
agriculture and alternative food production systems including permaculture.
Stay tuned for further news on these subjects!
|

|
|
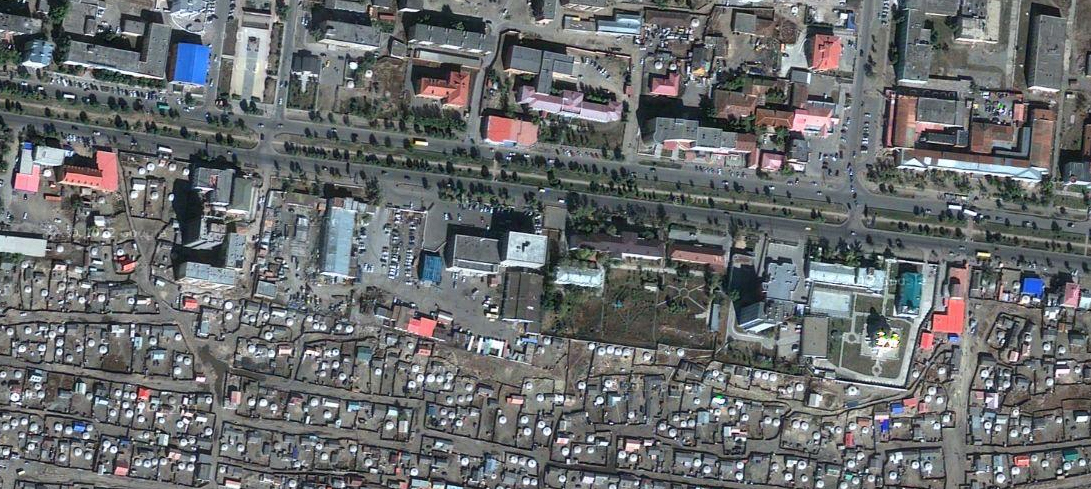
| Quiz: where is it? |
|
Play Mappamondo GIS quiz! Send the correct answer to
info@mappamondogis.com
. You will enter the monthly drawing to win a 10% discount voucher on any
of our products or services! The fastest player to send the answer will
be also rewarded. Send your name, surname, email and mailing address with
the name of the capital city depicted in the following satellite image:
|
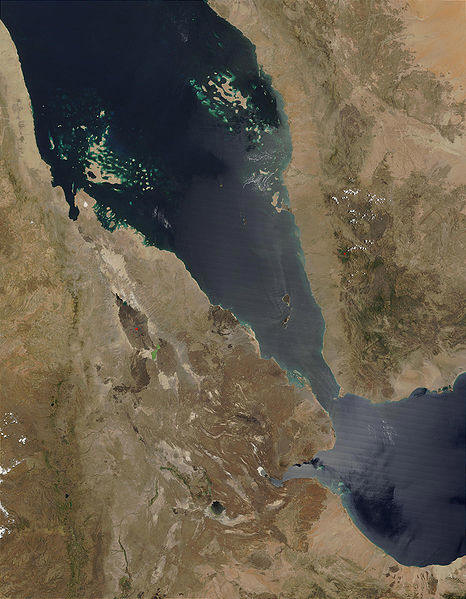 |
October 2011 edition
Answer: Afar Triple Junction
The Afar Triple Junction is a junction of three tectonic rifts (or
ridges) centered in the Afar Depression, informally known as the
Afar Triangle, of north-eastern Africa. Here, the Red Sea Rift meets
the Aden Ridge and the East African Rift. It also represents the
junction of the Arabian Plate and the two protoplates which are
beginning to form as the African Plate splits apart along the East
African Rift. The Afar depression, also known as Danakil Desert,
is one of the hottest place on earth and it's characterized by spectacular
geological features.
Read more
Winners: Congratulation to Giulia Fruscalzo
from Italy for winning the draw among all those that sent
the correct answer and to Patricia Moehring from Lebanon
to be the fastest player to send the right answer!
|
|
| Featured jobs |
|
Ocean Ecology Laboratory Chief - Greenbelt, Maryland - USA
Employer: NASA
Expires: January 11, 2013
Description: In addition to supervisory functions, the successful candidate
will serve as an expert consultant in planning, monitoring, and administering
ocean ecology projects of national or international significance. Specifically,
he or she will provide expertise and oversight for the development and testing
of advanced ocean color sensors, e.g., the Ocean Radiometer for Carbon Assessment
(ORCA) instrument; scientific expertise with respect to the Visible/Infrared
Imaging Radiometer Suite (VIIRS) instrument on JPSS and ocean related areas
of NASA's developing Carbon Monitoring system; serving as consultant and
scientific lead for ocean color issues related to NASA's PACE mission and
the ACE and GEOCAPE decadal survey missions; and providing leadership in
the planning and collection of mission validation field data and associated
campaigns
Link: http://careers.agu.org/jobs/5014244/ocean-ecology-laboratory-chief
Geospatial scientist - Toliara, Madagascar
Employer: Blue Venture
Expires: December 15, 2012
Description: Fundamental to this position is using satellite imagery, together with socioeconomic and biophysical GIS data, to map the distribution of mangrove forests and their carbon stocks, and develop models to quantify the emission reductions achievable through mangrove REDD+.
Link: http://blueventures.org/careers-overseas/geospatial-scientist-toliara-madagascar.html
|
| Software trial available for download |
|
Download our free trials with user manual,
tutorial and demo dataset!
Read more!


|
|
Fishery Analyst
Fishery Analyst is an ArcGIS 9.x and 10 application developed
to effectively analyze and visualize temporal and spatial patterns
of fishery dynamics. The main functions are quantitative estimation
and visualization of catch and effort and their variation in space
and time, analysis of fishing vessel utilization, data quality control,
and deriving information on the location of important economic and
threatened species. The application provides a user-friendly analysis
interface allowing for easy and diverse output production. The interface
allows the user to choose the analysis to perform (effort, catch
density, catch per unit of effort etc) and to select data on criteria
such as year, vessel name and/or size, and fish species caught.
The output can be generated as yearly, monthly, quarterly or user-defined
date interval plots. Results can be plotted in pre-defined map layouts
and saved in quantitative GIS data file formats (raster and vector)
or as graphic files and times series animations. The application
provides an option to produce non-confidential plots for data protected
by confidentiality policies.
Click here
to read more
|
|
|
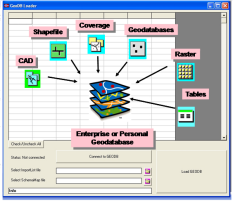
GeoDB Loader
The GeoDBLoader is an ArcObjects application for ArcGIS 9.x aiming
to automate and speed up the process of converting and transferring
spatial data from file based storage formats to a Personal or Enterprise
Geodatabase or between Geodatabases. It is suited for both, one
time operations, as well as for routine updates of a geodatabase.
It allows all the following: Mapping each input dataset (shapefile,
featureclass, other spatial format supported by ArcGIS) to a corresponding
featureclass in the output geodatabase; Mapping each input attribute
to one ore more corresponding attributes in an output featureclass
in the geodatabase; Mapping input attribute values to new output
values (e.g. to convert input values to standardized values); Creating
additional attributes and populate them with new values (constant
values or values from an input attribute); Mapping and/or creating
joined standalone tables;
|
|
|
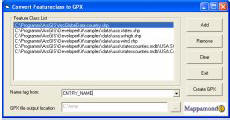
GPX converter
The GPX converter is an ArcObjects Application that allows for
easy conversion of your GIS data (shapefiles, feature classes in
a geodatabase) to GPX format (the GPS Exchange Format). GPX is a
light-weight XML data format for the interchange of GPS data (waypoints,
routes, and tracks) between applications and Web services on the
Internet. The GPX Converter is build for easy integration with ArcGIS
and ArcIMS.
|
|
|
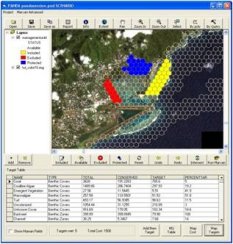
PANDA: Protected Areas Network Design Application (Free!)
P.A.N.D.A. is a stand-alone application developed using Visual
Basic and ArcObjects. It was developed to provide a user friendly
framework for systematic protected areas network design to ArcGIS
users. Through the use of P.A.N.D.A. the designer can explore different
hypothetical configurations of a system of protected areas in the
planning area. Conservation achievements and associated costs of
each scenario are based on the available data and knowledge. The
designer can edit the scenario by interactively modifying the status
of the planning units among 4 managed categories (Included, Protected,
Available, Excluded). He can then explore the target table to see
the resulting changes in conservation achievements of the new scenario
and the associated costs. P.A.N.D.A allows interacting with the
software MARXAN by providing an easy way to run Marxan over the
current scenario and display the results into ArcGIS format. ArcGIS
data files are converted to and from Marxan data files in the background.
The user can then use P.A.N.D.A. main interface to refine Marxan
solutions. Conservation features distribution, cost and Marxan irreplaceability
score can be easily mapped by pressing the corresponding buttons.
Click here to read
more...
|
|
|
| To remove your email address from this list send an email
to: newsletter-unsubscribe@mappamondogis.com
or
write to us. |

